 <\/div><\/div>
Precious Metals Frenzy: The Historic Leap and Deep Logic of the Gold Bull Market<\/h1>\nAbstract<\/h2>\n
Since the start of this precious metals bull market in December 2015, the international gold price has surged from USD 1,046.4\/oz to USD 5,598.75\/oz, with a maximum increase of 435%, making it the most eye-catching asset price movement in global financial markets over the past decade. This article systematically analyzes the intrinsic driving forces of this bull market from multiple dimensions including macroeconomic cycles, monetary policy shifts, geopolitical risks, and structural supply-demand changes, and explores its transmission effects across different markets and possible future developments. The study suggests that this gold bull market is not only a continuation of traditional safe-haven logic but also a concentrated manifestation of the reconstruction of the global monetary system, credit rebuilding, and risk preference restructuring, with its depth and breadth surpassing historically comparable periods.<\/p>\n
\n
I. Introduction: From Dormancy to Surge<\/h2>\n
In July 2026, international gold prices broke through the USD 5,500\/oz mark during Asian trading hours, setting a new historical record. For investors who have long tracked the precious metals market, this scene is both unexpected and understandable. Since gold hit a cyclical bottom of USD 1,046.4\/oz after the Fed's first rate hike in December 2015, gold prices have climbed over about ten and a half years, achieving a more than four-fold increase. As of now, the highest point of USD 5,598.75\/oz represents a 435% rise from the bottom, pushing this bull market to an unprecedented peak.<\/p>\n
This precious metals frenzy is not an isolated event. Silver, platinum group metals, and even palladium have shown a linked upward trend. Global gold ETF holdings have repeatedly hit new highs, and central bank gold purchases have exceeded 1,000 tons per year for several consecutive years. Against the backdrop of increasing divergence in the performance of traditional assets such as stocks, bonds, and commodities, gold, with its unique attributes of "no sovereign risk and no counterparty risk," has re-emerged as a cornerstone of asset allocation. This article aims to deeply interpret the historical context and core drivers of this bull market, providing investors with a rational and forward-looking perspective.<\/p>\n
<\/p>\n
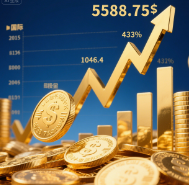
Figure: Monthly gold price chart. Starting from the low of USD 1,046.4\/oz in December 2015, gold prices have experienced three phases: slow rise, accelerated climb, and high-level consolidation, forming a long-term bull pattern lasting nearly ten years. <\/em><\/p>\n The first driving force of this bull market comes from the unconventional monetary easing of major global economies. After the Fed started its rate hike cycle in 2015, gold briefly came under pressure, but subsequent global economic slowdowns, trade frictions, and the impact of the COVID-19 pandemic in 2020 forced central banks to turn to unprecedented quantitative easing. The Fed's balance sheet swelled from less than USD 4 trillion to nearly USD 9 trillion, while the European Central Bank and the Bank of Japan also engaged in large-scale bond purchases. This flood of liquidity not only pushed up inflation expectations but also fundamentally eroded the credit foundation of fiat currencies—when nominal interest rates are far below inflation rates, real interest rates remain deeply negative, making the opportunity cost of holding gold close to zero or even negative, and activating gold's "zero-coupon bond" attribute to the maximum.<\/p>\n Since 2015, global geopolitical risks have risen in a stepwise manner: the UK Brexit referendum, Sino-US trade frictions, the Russia-Ukraine conflict, recurring tensions in the Middle East, and cross-strait tensions have all occurred one after another. Each geopolitical crisis triggered capital inflows into precious metals. Unlike the short-term impulses of past local conflicts, these crises exhibit characteristics of being long-term, complex, and core. For example, the Western financial sanctions against Russia after the Russia-Ukraine conflict (freezing central bank reserves, cutting off SWIFT) directly shook the global reserve system centered on the US dollar. Central banks around the world have reassessed the strategic reserve value of gold, sparking a "gold buying frenzy" starting from 2022—from 2022 to 2025, global central bank gold purchases averaged over 1,100 tons per year, far exceeding the average before 2010.<\/p>\n On the supply side, global gold mine production leveled off after reaching a historical peak of about 3,600 tons in 2018, with a sharp decline in the number of newly discovered large gold mines and rising mining costs due to higher energy and labor costs. Meanwhile, recycled gold supply increased somewhat under the stimulus of high prices, but long-term supply elasticity has significantly weakened against the backdrop of low capital expenditure. On the demand side, apart from central bank purchases, investment demand for gold bars and coins remained strong under inflation expectations and asset uncertainty, while ETF holdings, though occasionally volatile, remained at historically high levels. This contradiction between "supply rigidity and demand expansion" provides a solid fundamental support for price increases.<\/p>\n Looking back at the gold bull market after the collapse of the Bretton Woods system in the 1970s (1971-1980, an increase of about 2,300%) and the gold bull market during the subprime mortgage crisis from 2001 to 2012 (an increase of about 640%), the current bull market's 435% increase so far is not as high as that of the 1970s, but its duration has exceeded ten years, and the continuity of the uptrend and the limited correction amplitude (maximum correction about 20%-25%, far below the 30%-50% in past bull markets) indicate a qualitative change in market structure. Gold prices are no longer as highly sensitive to short-term fluctuations in the Fed's interest rate decisions as in the past, but are anchored to deeper changes in monetary credit and geopolitical landscape.<\/p>\n Historically, central banks bought gold as a "ballast stone" during market downturns and sold gold during rapid price increases (such as the Central Bank Gold Agreement from 1999 to 2002). However, one of the core features of this bull market is central banks' accelerated buying behavior at high prices: after gold broke through USD 3,000, countries such as China, India, Poland, and Singapore continued their purchases with undiminished intensity, even exceeding the levels during lower price periods. This "buying more as prices rise" behavior reflects central banks' long-term concerns about the credit risk of US dollar assets—even against the backdrop of the Fed pausing rate hikes and a weakening US dollar index, increasing gold holdings is still seen as a strategic measure to safeguard national financial security.<\/p>\n In the past, gold often rose and fell with US stocks (especially during liquidity crises), but in this bull market, the correlation between gold and risk assets has significantly decreased. In 2022 when US stocks fell sharply, gold strengthened against the trend; in 2024 when US stocks hit new highs, gold continued to climb. This dual attribute of "safe haven + growth" has elevated gold from a "tail risk hedging tool" to a "core asset" in investment portfolios, with institutional investor allocation ratios increasing from the traditional 2%-5% to 10% or even higher.<\/p>\n <\/p>\n Figure: The negative correlation between gold prices and US 10-year TIPS yields (real interest rates) has significantly weakened since 2023, indicating that gold pricing logic has transcended the traditional real interest rate framework and shifted to monetary credit and structural supply-demand logic. <\/em><\/p>\n High gold prices directly drove explosive profit growth for upstream mining companies. The net profit margins of major global gold miners (such as Newmont, Barrick, Shandong Gold, etc.) jumped from less than 5% in 2015 to 20%-35%, and capital expenditures accelerated accordingly. However, it takes 5-10 years for new projects from exploration to production, making it difficult to fill short-term supply gaps. Midstream smelting and downstream jewelry consumption face polarization: demand for investment bars and coins is strong, but jewelry consumption is suppressed by high prices. Global gold jewelry demand declined by about 10%-15% for three consecutive years from 2024 to 2026, with major consumer countries China and India showing a clear structural shift from "jewelry to investment."<\/p>\n The continuous rise in gold has raised concerns about a "substitution effect" on other assets. Some investors have reduced their holdings of bonds and increased allocations to gold, causing long-term government bond yields to rise passively even as inflation expectations have not dissipated. Regulators have also begun to watch for gold price bubble risks: the Commodity Exchange (COMEX) has raised margin requirements multiple times, and the Shanghai Gold Exchange has imposed trading limits on some contracts. However, compared with the situation at the historical high in 2011, when there was extreme contango and heavy speculative positions, the current market structure is relatively healthy—spot demand (central banks + ETFs) has been digesting inventory during the price rise, and commercial hedging positions in futures positions are reasonable, with no obvious signs of excessive speculation.<\/p>\n For emerging economies holding large amounts of US dollar reserves, the other side of the gold bull market is the continuous erosion of US dollar credit. India listed gold separately from reserve currencies in 2024, while Russia and Iran have used gold as an "anchor" for trade settlement, attempting to bypass the US-style financial system. This "de-dollarization" trend in turn further supports gold prices, forming a positive cycle. However, excessively rapid gold price increases also bring imported inflation pressure—for emerging market countries without gold mines, the rising cost of importing gold indirectly pushes up expectations of currency depreciation, putting pressure on foreign exchange markets in countries such as the Philippines and Egypt.<\/p>\n On the supporting side, the motivation for global central banks to buy gold remains ample—according to estimates from the World Gold Council, the current proportion of gold reserves in total reserves for emerging economies averages less than 8%, far below the 60%-70% of European and American countries, leaving at least 10,000 to 15,000 tons of potential additional holdings. In addition, the rise in the global inflation center (affected by population aging, energy transition costs, and rigid increases in service prices) means that real interest rates may remain low for a long time, which is a long-term positive for gold.<\/p>\n Risk factors cannot be ignored either: first, if the US economy unexpectedly achieves a "soft landing" and inflation continues to fall, real interest rates may turn positive, putting pressure on gold prices; second, digital assets such as Bitcoin have diverted some safe-haven demand from younger investors; third, the excessively rapid rise in gold prices has triggered "fear of heights," with some institutional investors starting to take profits. Technically, current gold prices are well above major moving averages, and the RSI indicator is in overbought territory, with short-term correction risks gradually accumulating.<\/p>\n Overall, this gold bull market is not over yet, but it will enter a mature phase of "high-level wide-range fluctuations with slowing pace." It is expected that over the next one to two years, the core fluctuation range of gold prices may be between USD 4,500 and USD 6,500\/oz. If geopolitical conflicts escalate or a credit event occurs (such as a default on a major sovereign debt), it could push towards USD 7,000. Conversely, if global central banks coordinate to tighten monetary policy or a new technological substitute emerges (such as controlled nuclear fusion or zero-cost storage breaking inflation logic), a trend inflection point should be watched for.<\/p>\n The gold bull market that began in December 2015, with a stunning performance from USD 1,046.4 to USD 5,598.75 (a 435% increase), has redefined the role of precious metals in the financial system. This is no longer a simple "safe-haven push" or "inflation trade" but the product of the combined effects of credit fission in the global monetary system, structural changes in economic cycles, and the reshaping of the geopolitical order. For investors, understanding the deep logic of this bull market is far more important than short-term price fluctuations—it means that in an era of unlimited fiat money supply, gold, which carries ultimate credit endorsement, has transformed from a "historical heritage" into a "core anchor of the future monetary system." No matter how far gold prices ultimately go, the thinking triggered by this surge will profoundly influence asset allocation logic for the next decade.<\/p>\n (Approximately 2,141 words)<\/strong><\/p>
\nII. Core Driving Factors of the Decade-Long Bull Market<\/h2>\n
2.1 Deep Implications of Global Liquidity Flooding and Negative Interest Rate Environment<\/h3>\n
2.2 Geopolitical Landscape Reshaping and Impulsive Outbursts of Safe-Haven Demand<\/h3>\n
2.3 Structural Supply-Demand Imbalance: Peak Mine Production and Central Bank Lock-Up Effect<\/h3>\n
\nIII. Historical Uniqueness and Structural Characteristics of This Bull Market<\/h2>\n
3.1 Exceeding Traditional Cycle in Magnitude and Duration<\/h3>\n
3.2 Central Banks Shift from "Bystanders" to "Protagonists"<\/h3>\n
3.3 Weakening Asset Price Linkage and Emergence of Independent Trends<\/h3>\n
\nIV. Systemic Impact of High-Level Bull Market Operations<\/h2>\n
4.1 Reshaping the Precious Metals Industry Chain<\/h3>\n
4.2 Financial Market Rebalancing and Risk Prevention<\/h3>\n
4.3 Monetary Stability and Capital Flows in Emerging Markets<\/h3>\n
\nV. Future Outlook: How Far Can the Bull Market Go?<\/h2>\n
5.1 Bull-Bear Game of Supporting Factors<\/h3>\n
5.2 Possible Evolution Paths<\/h3>\n
\nVI. Conclusion<\/h2>\n
\n